Walk the important rooms
Tech Genie records signal at labeled spots like router area, hallway, office, bedroom, garage, conference room, front desk, or the weak room.

Home Wi‑Fi coverage check · Los Angeles
We measure the signal where you use it: your desk, bedroom, TV or back room. The map shows where coverage drops and helps you decide whether to move equipment or add a connection.
Coverage checks start around $175+. Larger properties, multiple buildings, wiring, mounted access points, and a separate validation visit are quoted before that work starts.
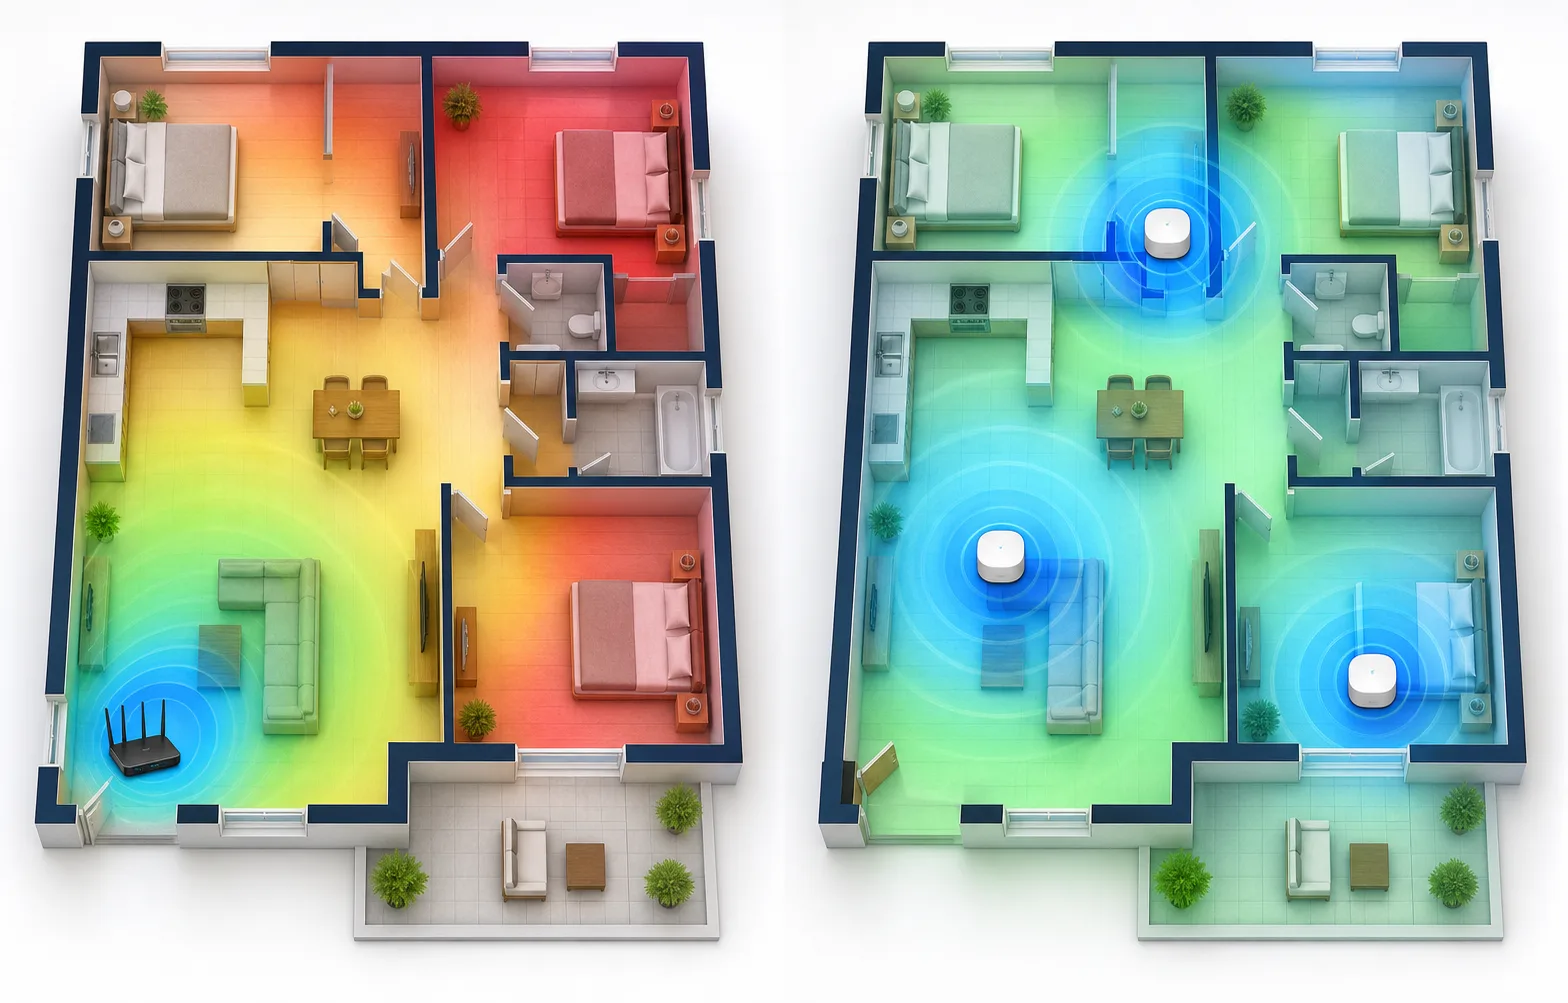
Measure
Room-by-room
Compare
Before + after
Decide
Place gear smarter
On-site measurements show usable, weak, and unmeasured areas so equipment placement is based on evidence.
Why it helps
A speed test beside the router won’t explain why calls drop at your desk. We take readings at labeled spots around the property so you can compare coverage. Rooms we haven’t measured are marked as unmeasured.
What you get
Tech Genie records signal at labeled spots like router area, hallway, office, bedroom, garage, conference room, front desk, or the weak room.
The report marks usable, weak, poor, and unmeasured areas. Missing readings are never presented as artificial -100 dBm results.
Mesh nodes, extenders, and access points work best when the site survey shows where strong signal stops and weak coverage begins.
You get a local visual report, data table, recommendations, and an optional before/after comparison.
Privacy-focused field survey
The survey records only the signal and location details needed to create your coverage report. It does not collect passwords, browsing history, or personal files.
Coverage-check deliverables
Use the readings to compare options: move a mesh node, add a wired access point or check the incoming internet connection before changing your Wi-Fi equipment.
Vendor-neutral placement help
Tech Genie can assess many common Wi‑Fi and mesh systems. Exact controls depend on the model, manufacturer app, firmware, and customer-controlled account access.
Service limitations
This is a measured walk test for homes and small offices, not a certified enterprise predictive RF design, spectrum-analysis package, or engineering survey for campuses, hospitals, warehouses, or regulated sites.
Built around Los Angeles spaces
Building materials can weaken coverage in ways another random extender does not solve.
Nearby networks, fixed gateway locations, and no-drilling rules change the practical options.
Vertical separation and distant rooms can expose weak backhaul between mesh nodes.
Detached or outdoor coverage may need a wired access point or bridge assessment instead of more pucks.
The office, video-call seat, printer, and VPN path matter more than one fast reading beside the router.
Printers, cameras, POS devices, guests, and workstations need a documented coverage plan.
Dead zones, bedrooms, garages, patios, cameras, smart-home devices, and mesh placement problems.
Desks, printers, conference rooms, cameras, shared devices, and business Wi‑Fi that needs documentation.
A map can show whether you need better placement, mesh, a wired access point, or an ISP/router fix.
Wi‑Fi coverage check FAQ
For Tech Genie, a Wi-Fi heatmap is a visual walk-test report that shows measured coverage by room or area. A wireless site survey is the practical field check behind it: walking the site, checking weak zones, reviewing router or access point placement, and recommending the next step.
Yes. A heatmap helps show where Wi-Fi is strong, weak, or unmeasured so mesh nodes and access points are not placed inside the dead zone they are supposed to fix.
No. The heatmap workflow measures Wi-Fi coverage without requiring Wi-Fi credentials, GPS tracking, personal files, or browser history.
Tech Genie Wi-Fi coverage checks start around $175. Larger properties, multiple floors or buildings, wiring design, access-point work, and a separate return visit for after-change validation are quoted by scope.
No. An existing floor plan can help, but it is not required for a practical room-by-room walk test. Tech Genie can label the important rooms and measurement spots without collecting GPS history.
Yes, when the approved fix fits the visit. Tech Genie can help reposition or configure supported equipment and can quote mesh hardware, wired access points, Ethernet, or larger changes separately. Post-change measurements can verify the result.
No. This is a practical onsite walk test for homes and small offices. It does not claim to replace a certified enterprise predictive survey, spectrum analysis, or engineering package for campuses, hospitals, warehouses, or regulated projects.
Turn this into recurring value
For homes and businesses with repeat Wi‑Fi complaints, the first heatmap becomes a baseline. Later visits can compare signal after router moves, mesh changes, wireless site survey findings, wiring, or access-point upgrades.
Tech Genie is not a licensed contractor. Construction-related work is limited to casual, minor, or inconsequential projects totaling less than $1,000 for labor, materials, and all other items, requiring no building permit, and performed without employees or paid helpers.